Vertical Bars In Graphite
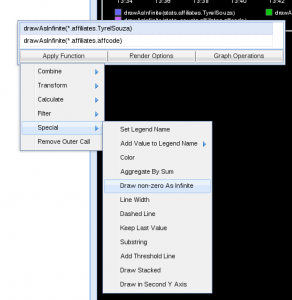
I am working with txStatsD and Graphite. I was having the hardest problem looking through the txStatsD code today finding how to graph something as an event, not a data point. I eventually went into every option on the graphite dashboard and found an option to make a bar.

This is the option that you must use when you want to mark events. For example we want to know "Server restarted", we would use this technique, as it doesn't make sense to aggregate "server restarted". Using nonzero as infinite is a good way to show an event took place.
[read post]